Volume Profile Confirmation

The volume profile identifies where orders sit relative to price action, and every teardown orb trading discipline thinkheyday has logged shows the same thing regarding the validity of an opening range breakout. High volume at the breakout point confirms that institutional interest is driving the expansion away from the initial balance. A successful orb requires more than just a price level breach. It requires a shift in the intraday volume distribution to support the new direction.
The Mechanics of Volume at the Breakout
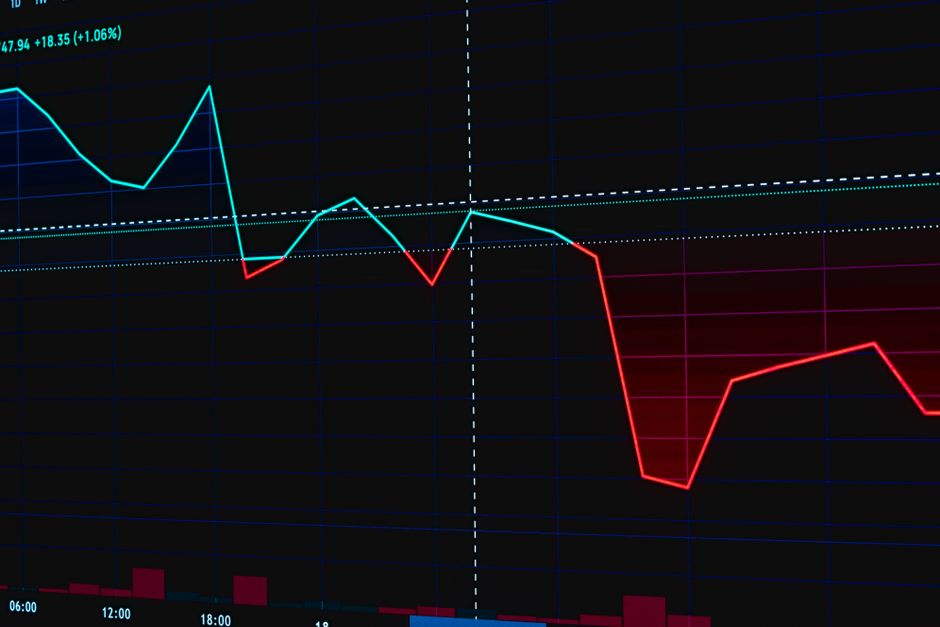
A breakout occurring on thin volume often fails because no significant participation exists to sustain the move. The process involves watching the volume profile build during the first fifteen minutes of the session. When the price moves outside the established five minute range, the volume at that specific price level must spike. This spike indicates that the breakout is not a momentary lapse in liquidity but a genuine shift in supply and demand. If the volume at the break point remains lower than the volume within the initial range, the move lacks the necessary momentum to hold.
Relative Volume Analysis
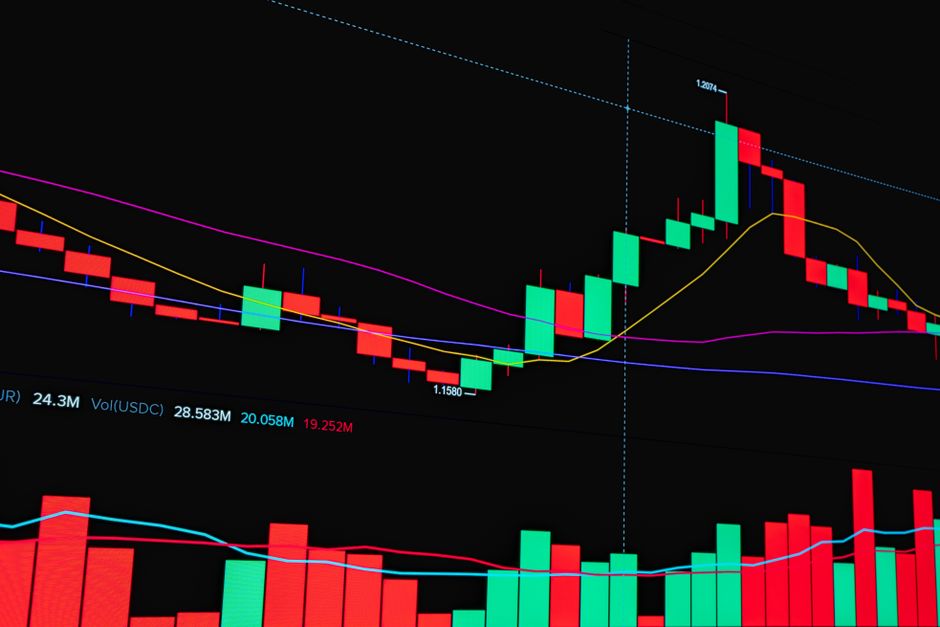
Comparing the volume at the breakout to the volume within the opening range provides a mathematical basis for the move. A valid opening range breakout displays a relative volume increase at the moment of the breach. During regular trading hours, the volume at the break point should exceed the average volume seen during the premarket session. If the volume profile shows a high volume node forming right at the breakout level, the price has found support or resistance that attracts participants. This mechanical check separates high conviction moves from false breakouts that quickly revert to the mean.
Timeframe and Profile Sensitivity
The choice of timeframe dictates the shape of the profile. A thirty minute range provides a broader context of where the bulk of the volume resides. When price exits a thirty minute range, the volume at the exit point must be significant relative to the volume inside the range. Using a 15 minute profile helps identify micro-structures, but the larger scale volume nodes often dictate the ultimate direction of the session. A small sample of trades shows that ignoring the volume profile leads to catching falling knives or fading strong trends.
Validating the Trend Continuation
Once the price moves beyond the initial range, the volume profile must show a migration of high volume nodes toward the new price levels. If the volume remains trapped inside the original opening range, the breakout is likely a trap. Successful moves see the volume profile extend away from the session high or session low. This extension proves that the market is accepting the new price levels. Watching the volume profile during the first hour provides the necessary data to confirm if the initial direction has the strength to persist through the mid day lull.