Pre-Market Context Assessment

Before the bell rings, the data found in the running record orb trading discipline thinkheyday holds shows how premarket volatility dictates the initial direction. A trader evaluates the overnight session to determine if the price action stays within established bounds or breaks out. This discipline requires a mechanical look at the opening range to identify where liquidity sits before the market open occurs. The data collected through an orb strategy relies on these specific levels to define the intraday bias.
Defining the Overnight Range
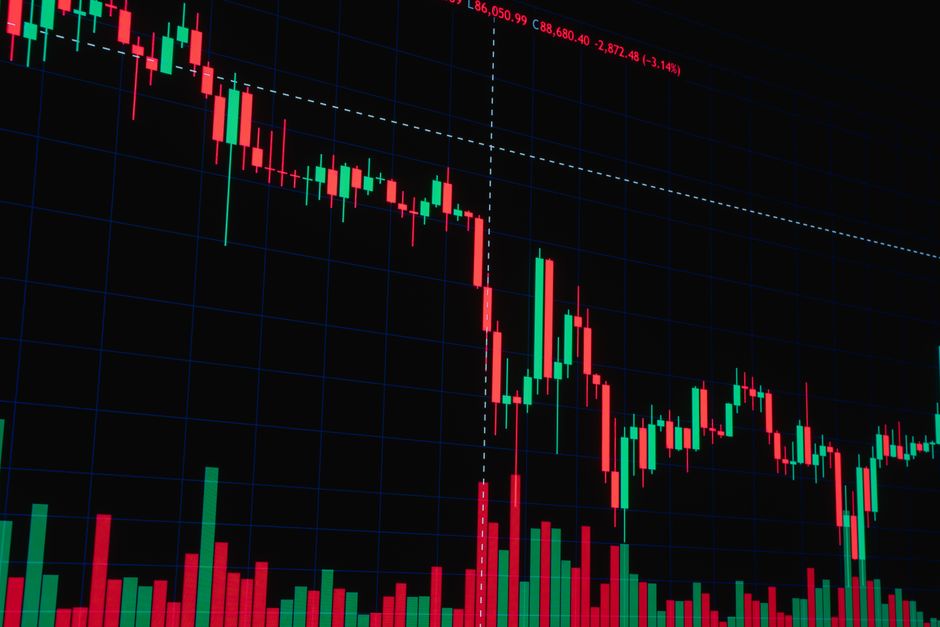
The overnight session establishes the initial boundaries for the upcoming regular trading hours. Mapping the session high and the session low provides the first set of coordinates. If the price moves significantly away from these levels during the premarket, the subsequent opening range breakout might lack the necessary depth. A tight overnight range often leads to a volatile expansion, whereas a wide range suggests a period of consolidation. The math remains constant. The levels are drawn based on the actual price extremes recorded while the main exchanges were closed.
The First Fifteen Minutes
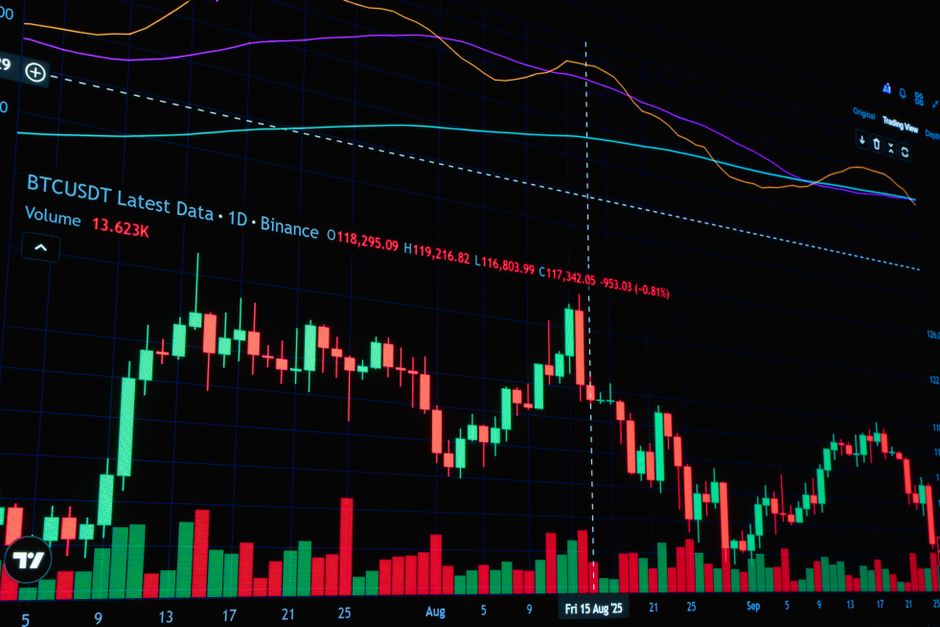
The first fifteen minutes provide the first real test of momentum. During this timeframe, the five minute range often reveals the immediate intent of institutional participants. A failure to hold the high of the first five minute candle frequently leads to a reversal toward the session low. Mechanical execution depends on watching how the price reacts to these early boundaries. A breakout that occurs with low volume during the first fifteen minutes is often a false signal. The data shows that volume must confirm the move to validate the direction.
Expanding the Timeframe
Scaling up to the fifteen minute range allows for a clearer view of the trend. While the five minute candles offer detail, the fifteen minute range filters out much of the noise. If the price stays above the opening range, the bias remains bullish for the first hour. A shift in the thirty minute range can signal a change in the intraday trend. Each timeframe adds a layer of structure to the chart. The work involves plotting these levels as soon as the cash open occurs.
Volatility and Volume Profile
Volume profile analysis during the premarket helps identify high volume nodes. These nodes act as magnets or barriers. When the price approaches a high volume node during the opening range, the speed of the move often slows. A rapid move through a low volume area suggests a strong opening range breakout. Measuring the distance between these nodes and the current price determines the potential for a trend extension. The mechanical process ignores sentiment and focuses only on the location of the volume.
Execution at the Opening Bell
At the opening bell, the orders are matched and the initial volatility spikes. The goal is to identify the direction once the opening range is set. Following the thirty minute range provides a more stable entry point than chasing the initial spike. A trader waits for the price to stabilize within the established timeframe. The process is repetitive. The levels are drawn, the volume is measured, and the price is observed relative to the overnight session limits.