The False Breakout Filter
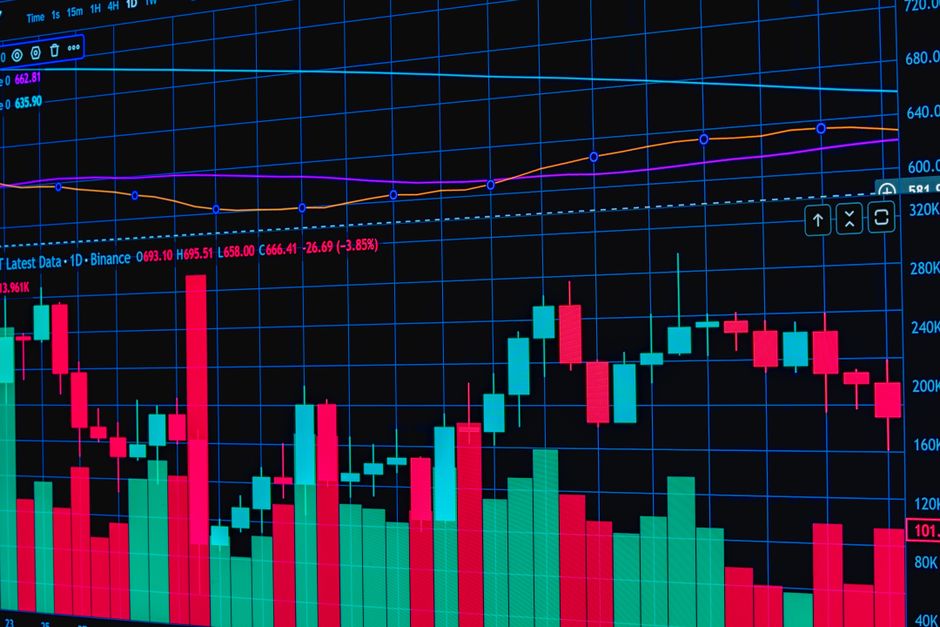
The false breakout filter identifies price movement that penetrates a defined boundary only to reverse immediately. Every teardown orb trading discipline thinkheyday has logged shows the same thing regarding the failure of an opening range breakout to find follow through. A technician observes the initial expansion and notes when the liquidity trap occurs. This process requires measuring the first fifteen minutes of price action to establish a baseline for intraday volatility. The mechanism relies on the rejection of the session high or session low shortly after the market open.
Defining the Boundary
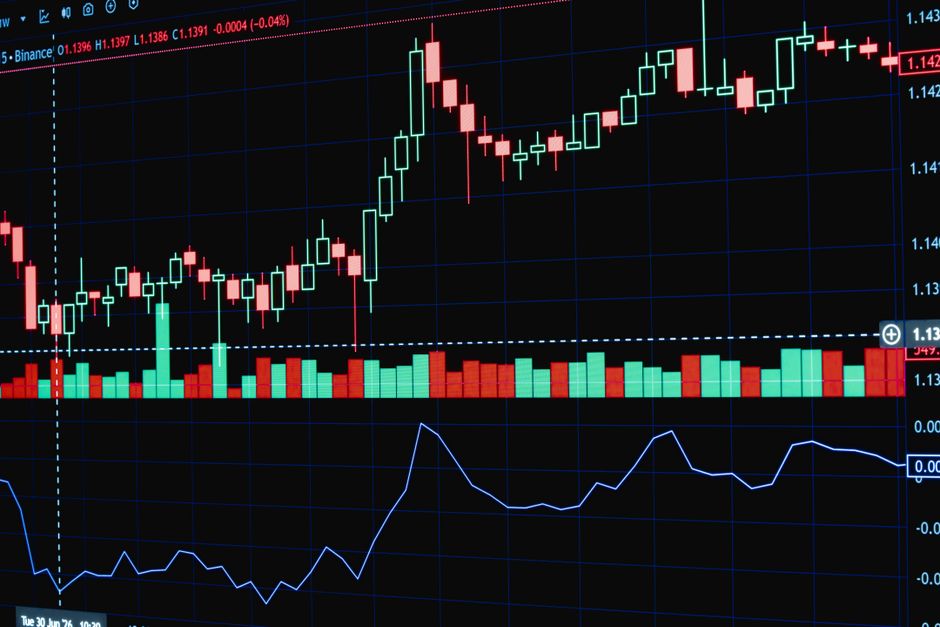
The procedure starts with the selection of a specific timeframe. A five minute range provides the initial levels, but the thirty minute range often offers more significant structural support. Once the opening bell rings, the price must establish a clear high and low. This boundary serves as the threshold for the filter. If the price crosses this line and fails to hold, the false breakout is confirmed. The data shows that many traders mistake a brief excursion for a trend shift. The mechanical reality is that the liquidity is often sitting just outside the established opening range, pulling price into a trap before the reversal begins.
Identifying the Reversal Signal
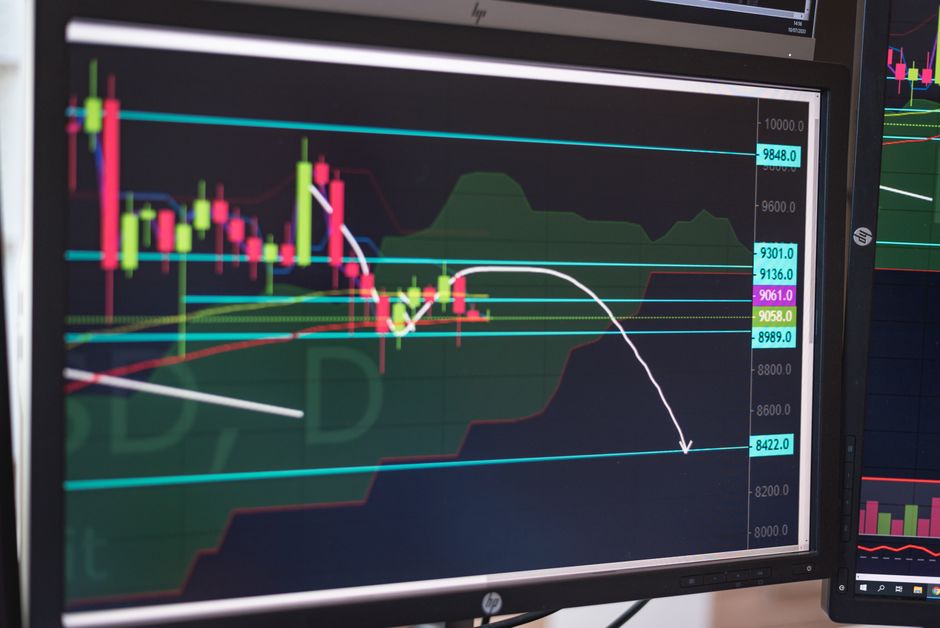
A signal occurs when a candle pierces the level and closes back within the previous range. This failure is most evident when looking at the 15 minute chart. The candle must show a long wick or a significant body reversal. A small sample overstates the edge, so the observation must be consistent across multiple days. If the price moves beyond the opening range but lacks the volume to sustain the move, the filter triggers. The movement is often a hunt for stops rather than a true shift in market direction. This pattern frequently repeats during regular trading hours as the initial volatility settles.
Volume and Velocity Metrics
Volume must be analyzed alongside the price action. A valid breakout carries heavy volume. A false breakout typically shows a spike in volume followed by a rapid drying up of participation. This lack of follow through indicates that the move lacked the necessary participation to sustain the expansion. The velocity of the return to the mean is a measurable metric. A rapid return to the center of the range suggests the breakout attempt was an exhaustion move. This mechanical observation separates a genuine trend from a momentary liquidity grab.
Execution of the Filter
The filter works by looking for a specific sequence of events. First, the price breaches the opening range. Second, the price fails to stay above that level for the duration of a single timeframe. Third, the price returns to the prior range boundary. This sequence provides a concrete basis for identifying failed momentum. The work involves watching the price interact with the levels established during the first hour of the session. Accuracy in this procedure requires strict adherence to the chosen levels without deviation.